A variety of colorful gift cards are scattered across a wooden surface. The cards are in shades of green, blue, orange, and yellow, each with the text Gift Card written on its surface.

Points versus gift cards

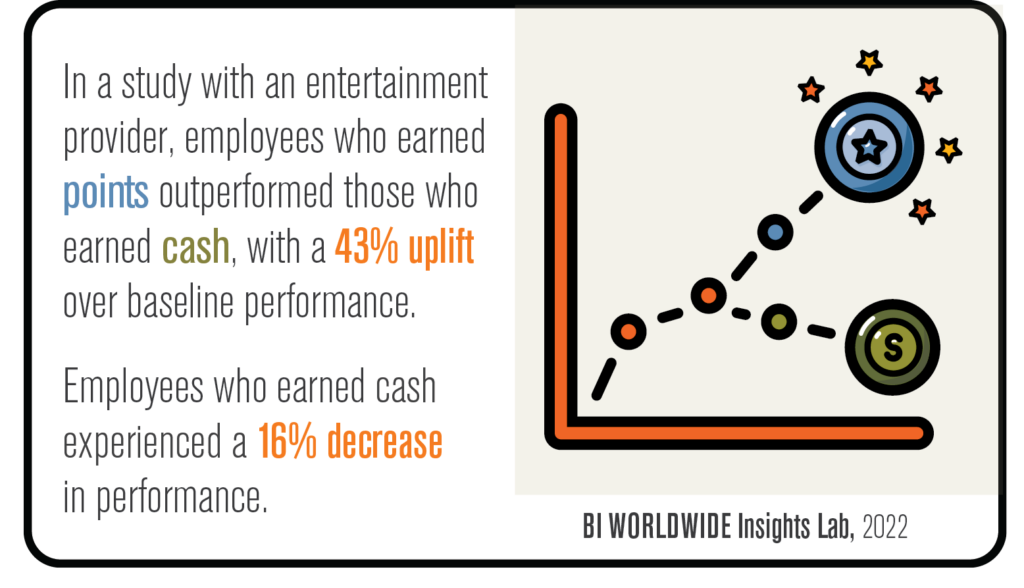
The New Rules of Engagement® research shows employees who feel their organization’s incentives are exciting are eight times more likely to be inspired at work. But not all rewards drive behavior change and results.

William Johnson , Division Vice President, Sales and Channel More about the author

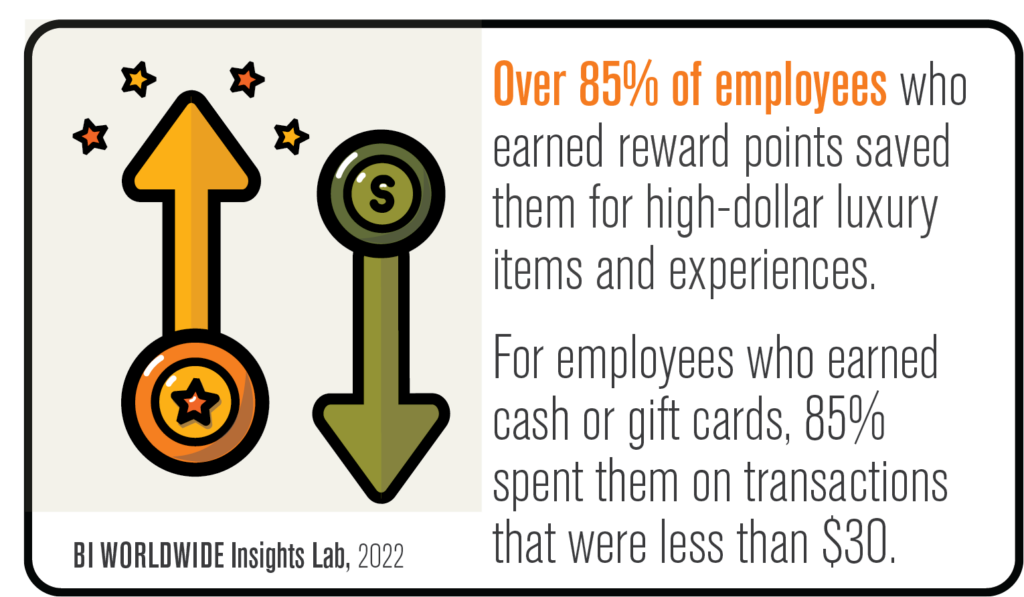
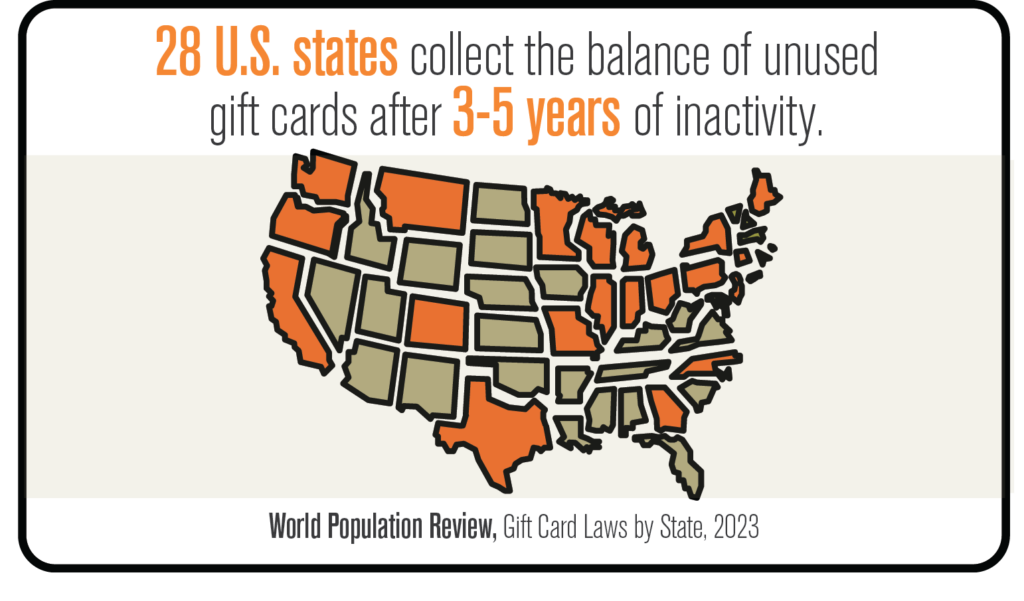
Here are seven stats highlighting the differences between points versus gift cards. Gift cards are often seen as a form of cash, whereas points can be used for inspirational rewards like experiences, travel and merchandise.

Two arrows, one gold with a star and one green with a dollar sign, illustrate a statistic: Over 85% of employees saved reward points for luxury items, while 85% spent cash or gift cards on purchases under $30.
Infographic showing 47% of U.S. adults have at least one unused gift card ($21 billion in 2022). A crossed-out gift card icon is in the center, with stylized people around it. Source: Bankrate, 2022.
Illustration of a target with an arrow in the bullseye. Text reads: In a recent study with a telecom company, employees who received points achieved their sales goals 28% more often than employees rewarded with cash. BI WORLDWIDE Insights Lab, 2022.
A graphic showing a broken orange gift card with a bow. Text explains that gift card breakage accounted for nearly $106 million in 2017, with a note that this refers to discarded cards with small amounts left.
An infographic shows an upward arrow, a star, and a circle with text stating employees rewarded with points perceived a 52% greater incentive value per dollar spent by the company, citing Carlson School of Management.
A map of the U.S. highlights 28 states in orange, indicating they collect unused gift card balances after 3-5 years of inactivity. Text above the map explains this law. Source: World Population Review, 2023.
An infographic shows a dotted line graph with increasing performance, star and dollar icons, and text: Employees earning points outperformed those earning cash by 43%, while cash earners had a 16% decrease. BI WORLDWIDE Insights Lab, 2022.

Download the full PDF article.